18
RATIONAL FUNCTIONS
A RATIONAL FUNCTION is a quotient of polynomials. It will look like this:
| y = | g(x) h(x) |
where g and h are polynomials (h ![]() 0).
0).
Now a denominator maynot be 0. The symbol ![]() has no meaning. Therefore, in the rational function
has no meaning. Therefore, in the rational function
![]() , x may not have the value 8. 8 is called a singularity of that function.
, x may not have the value 8. 8 is called a singularity of that function.
A singularity of a function is any value of the variable that would make a denominator 0.
Problem 1. In each of the following, which values of x may not be included in the domain? That is, which values are the singularities of the function?
To see the answer, pass your mouse over the colored area.
To cover the answer again, click "Refresh" ("Reload").
| a) y = | 1 x |
x = 0 | b) y = | 1 x + 5 |
x = −5 | c) y = | 1 2x + 1 |
x = −½ |
| d) y = | 1 x2 − 16 |
x = 4 and −4 | e) y = | 1 x2 + x − 6 |
x = −3 and 2 |
The reciprocal function
In Topic 8 we saw the graph of the reciprocal function,
| y = f(x) = | 1 x |
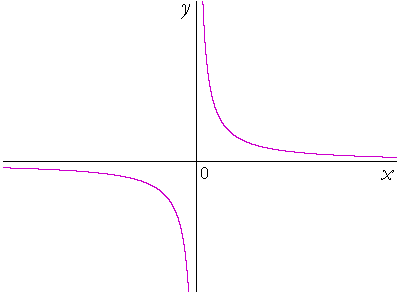
That is also the equation of a hyperbola, which, like the parabola, is one of the conic sections.
But say that we did not know how to draw the graph. Then we would ask -- and answer -- the following questions. The student should understand that these same questions must be answered when drawing the graph of any rational function.
1. Is the graph symmetrical with respect to the y-axis or to the
1. origin?
Answer. We must look at f(−x):
| f(−x) = | 1 −x |
= − | 1 x |
= − | f(x). |
Since f(−x) = −f(x), the graph is symmetrical with respect to the origin. Hence, we need only draw the right-hand side. The left side will follow from the symmetry.
2. Are there any x- or y-intercepts?
| Can we solve y = | 1 x |
= 0 ? |
No, we cannot, because a fraction will equal 0 only if the numerator is 0. (Lesson 5 of Algebra.) Therefore there are no x-intercepts.
And x may not be 0. Therefore, there are no y-intercepts, either.
3. What happens to the value of y when x is very large?
| y = | 1 x |
If x is a very large positive number, then y will be a very small positive number. This means that at the extreme right end of the x-axis,
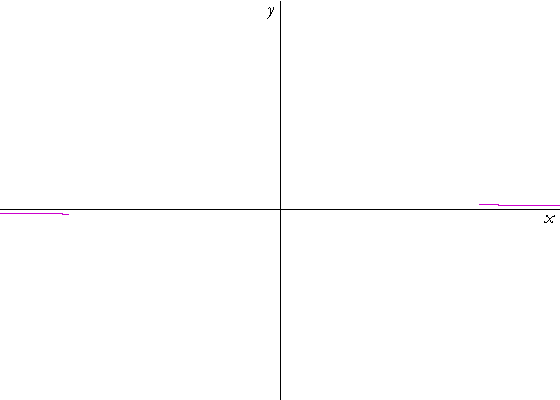
the height of the graph -- the value of y -- will be very close to the
x-axis, and on the positive side:
4. Where is the singularity of this function?
At x = 0.
5. What happens to the value of y when x is close to a
5. singularity?
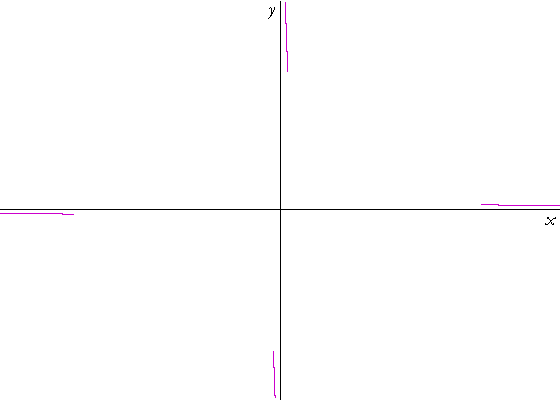
y becomes extremely large:
| y = | 1 x |
When x is close to 0 in this case -- when x is a very small positive number -- then y, its reciprocal, will be a very large positive number.
Now, we know that there are no intercepts. And x will take every value greater than 0. Therefore, those two ends of the graph must
| connect. Here is the graph of y = | 1 x |
: |
Briefly, an asymptote is a straight line that a graph comes closer and closer to but never touches.
The x-axis is a horizontal asymptote of that graph. The graph and the x-axis come closer and closer but never touch.
More precisely:

"The horizontal line y = b is a horizontal asymptote of the graph of
y = f(x)" means: Upon naming any positive number, however small, it will be possible to name a value of f(x -- call it f(x0) -- such that the distance between f(x0) and b -- and all subsequent values of |f(x) − b| -- will be smaller than that small number.
In other words, the distance between the graph and the horizontal asymptote becomes almost 0.
The y-axis is a vertical asymptote of that graph.
It is true that the distance between the graph and the vertical axis becomes almost 0. But what it is important is to see that, as a graph approaches a vertical asymptote, its absolute value becomes extremely large.

"The vertical line x = a is a vertical asymptote of the graph of
y = f(x)" means: Upon naming any positive number, however large, it will be possible to name a value of x close to a -- call it x0 -- such that the absolute value of f(x0), and all values with x closer to a, will be larger than that large number.
Thus at values of x close to a singularity -- when the denominator is an extremely small number, almost 0 -- the values of the function become extremely large.
Problem 2. Where do we always find a vertical asymptote of a graph?
At a singularity.
Problem 3.
a) What does the equation of a vertical asymptote look like?
x = A number.
b) What does the equation of a horizontal asymptote look like?
y = A number.
Problem 4. Write the equation of the horizontal asymptote of y = 1/x.
y = 0.
Problem 5. Write the equation of the vertical asymptote(s) of each of the following.
| a) y = | 1 x |
x = 0 | b) y = | 1 x + 5 |
x = −5 | c) y = | 1 2x + 1 |
x = −½ |
| d) y = | 1 x2 − 16 |
x = 4 and x = −4 |
| e) y = | 1 x2 + x − 6 |
x = −3 and x = 2 |
Problem 6. Each of the following is a translation or transformation of
| y = | 1 x |
. Sketch the graph of each one. |
| a) y = | 1 x − 3 |
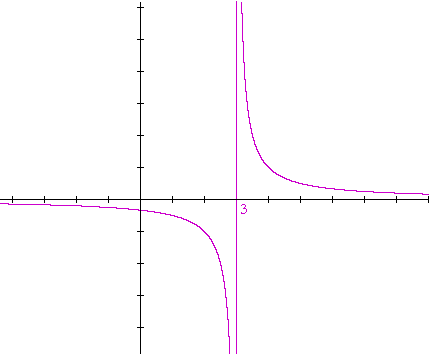
| b) y = | 1 x + 2 |
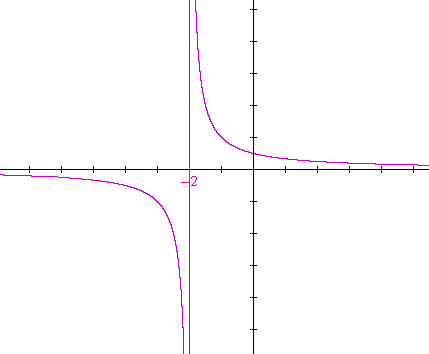
| c) y = − | 1 x + 2 |
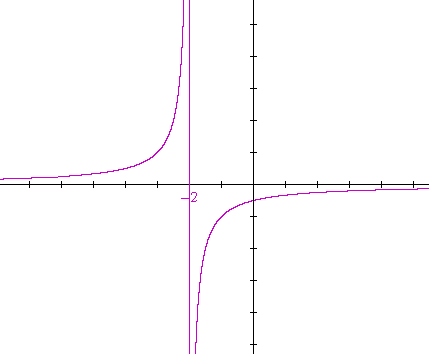
This is a reflection about the x-axis of graph b).
| d) y = | 1 x − 3 |
+ 2 |
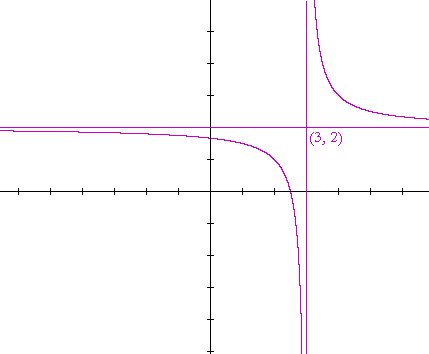
Please make a donation to keep TheMathPage online.
Even $1 will help.
Copyright © 2021 Lawrence Spector
Questions or comments?
E-mail: teacher@themathpage.com

